Getting started
Overview
This document provides an introductory guide for integrating the Legit.Health AI models using the JSON API. This guide is intended to help your teams prepare for the implementation before consulting the detailed API documentation.
Throughout this documentation, we'll use {path} to reference the base URL and version of the API.
For example: {path}/auth/login means https://plus.legit.health/version/auth/login
Used Endpoints
The integration process involves the following endpoints:
/auth/login: Authentication endpoint to obtain access tokens./clinical/diagnosis-support: Endpoint for obtaining diagnostic support based on image and body site inputs./clinical/severity-assessment: Endpoint for quantification of the visual signs
Basic example
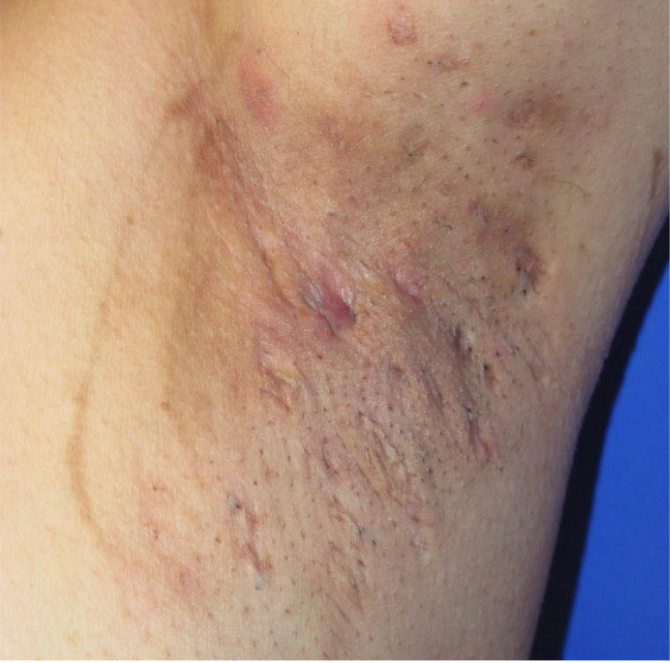
To help you get started with the API integration, we will provide a simple example image of Hidradenitis Suppurativa. This single example allows you to:
- Test the complete integration workflow:
- Authenticate with the API
- Send an image for analysis
- Receive diagnosis support results
- Receive visual signs results
- Understand the request and response formats for each endpoint:
- How to properly format image data
- What responses to expect
- How to handle the API tokens
Once this basic integration is working correctly, we can proceed with additional test materials for more complex scenarios.
Example
| Image name | Download image | Download image base64 code |
|---|---|---|
| Hidradenitis suppurativa example | ⬇️ Download Image | ⬇️ Download base64 |
You can find more example images in the: Materials for Integration - Extended section of this installation manual.
Endpoint Request Examples
Authentication /auth/login
Using Postman
Body
Add the username and password keys and values to authenticate.
Screen capture of Authorisation tab of the Postman dekstop app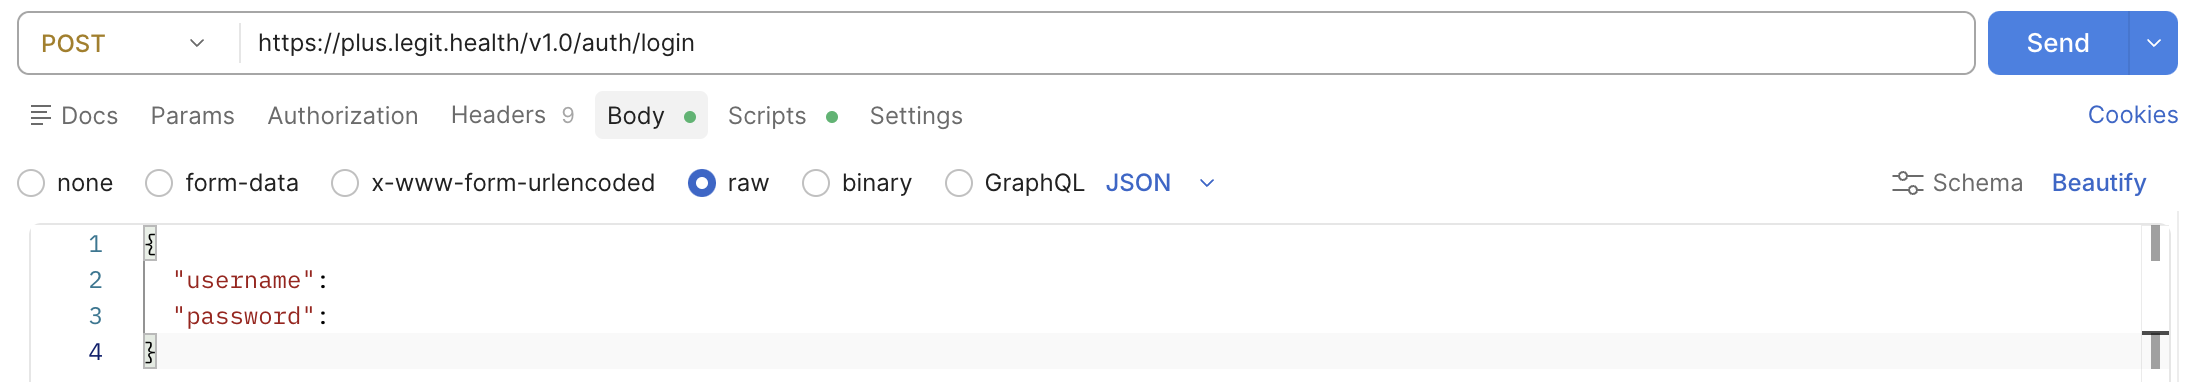
Headers
This /login endpoint expects a JSON body with Content-Type: application/json.
Send the credentials as a raw JSON object:
{
  "username": "your_username",
  "password": "your_password"
}
Following figure shows how to set the headers in Postman.
Screen capture of Authorisation tab of the Postman desktop app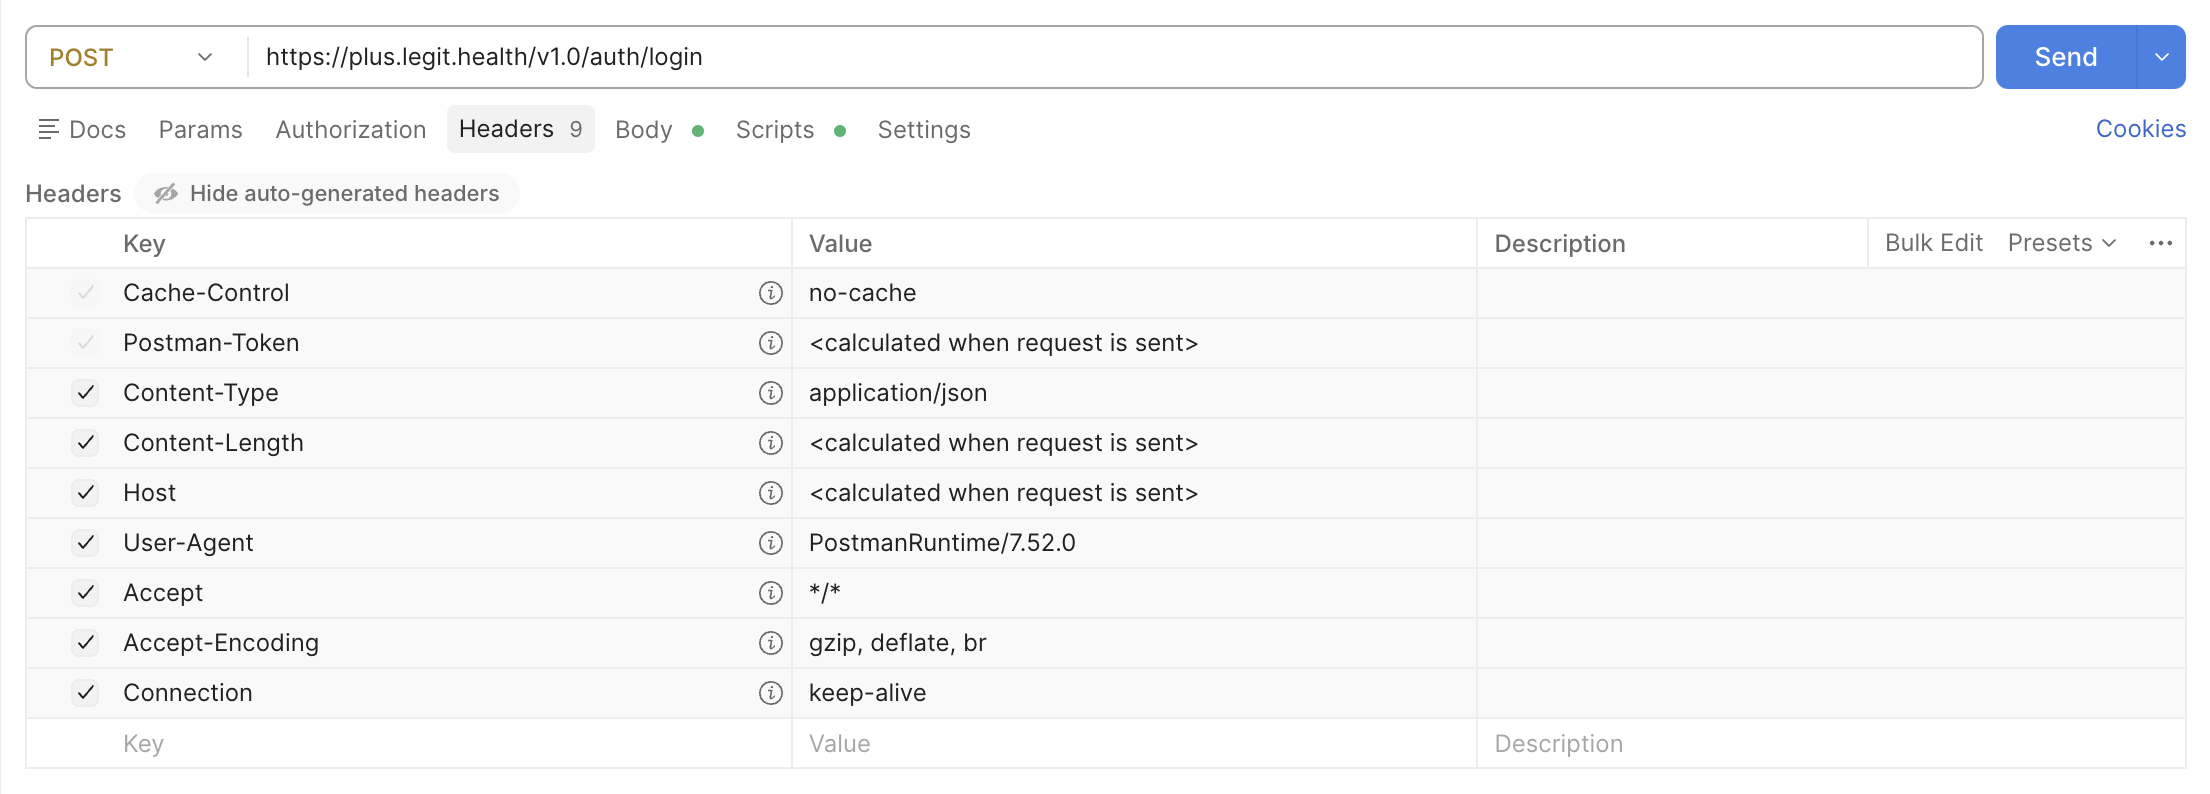
Code Examples
Request
Python Example
import requests
from requests.exceptions import RequestException

def login(base_url: str, username: str, password: str) -> dict:
"""
Authenticate with the API and get access token.

    Args:
        base_url: The base URL of the API
        username: Your API username
        password: Your API password

    Returns:
        dict: Response containing access_token, token_type and expires_in

    Raises:
        RequestException: If the request fails or returns non-200 status
    """
    try:
        # Create a session for connection pooling and cookie persistence
        http_session = requests.Session()

        # Make the login request
        request_response = http_session.post(
            f"{base_url}/login",
            json={
                "username": username,
                "password": password
            },
        )

        # Raise error for non-200 responses
        request_response.raise_for_status()

        # Return the JSON response
        return request_response.json()

    except RequestException as e:
        print(f"Login failed: {str(e)}")
        raise

# Example usage

try:
response = login(
base_url="{{path}}",
username="your_username",
password="your_password"
)
print("Successfully logged in")
print(f"Access token: {response['access_token']}")
print(f"Token type: {response['token_type']}")
print(f"Expires in: {response['expires_in']} seconds")

except RequestException:
print("Failed to authenticate with the API")
Response:
{
  "accessToken": "eyJhbGciOiJIUzI1NiIsInR5cCI6IkpXVCJ9...",
  "tokenType": "bearer",
  "expiresIn": 3600
}
Common Headers
{
  "accessToken": "eyJhbGciOiJIUzI1NiIsInR5cCI6IkpXVCJ9...",
  "tokenType": "bearer",
  "expiresIn": 3600
}
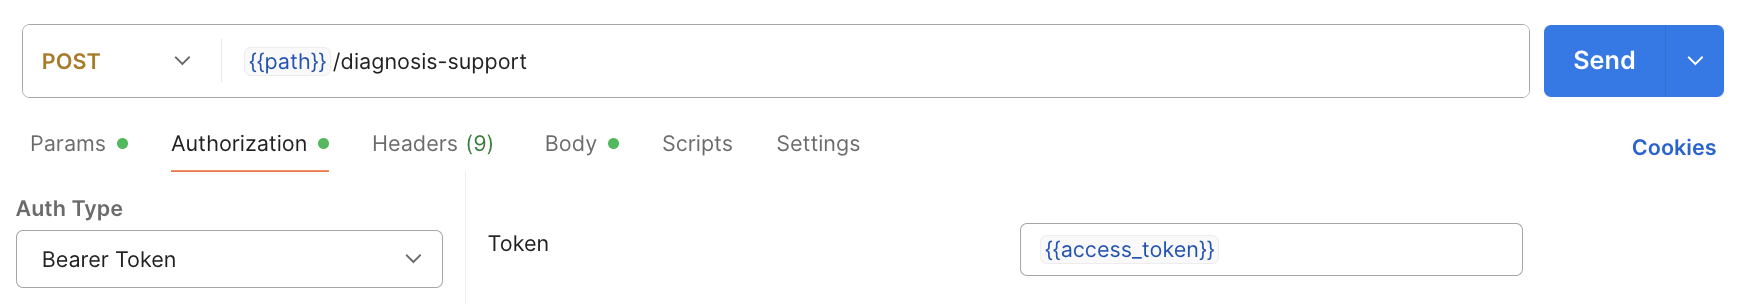
Common Headers
All requests (except
/login) should include the bearer token obtained from the/loginendpoint in theAuthorizationheader.Postman Example
Diagnosis Support /clinical/diagnosis-support
Using Postman
Screen capture of Authorisation tab of the Postman desktop app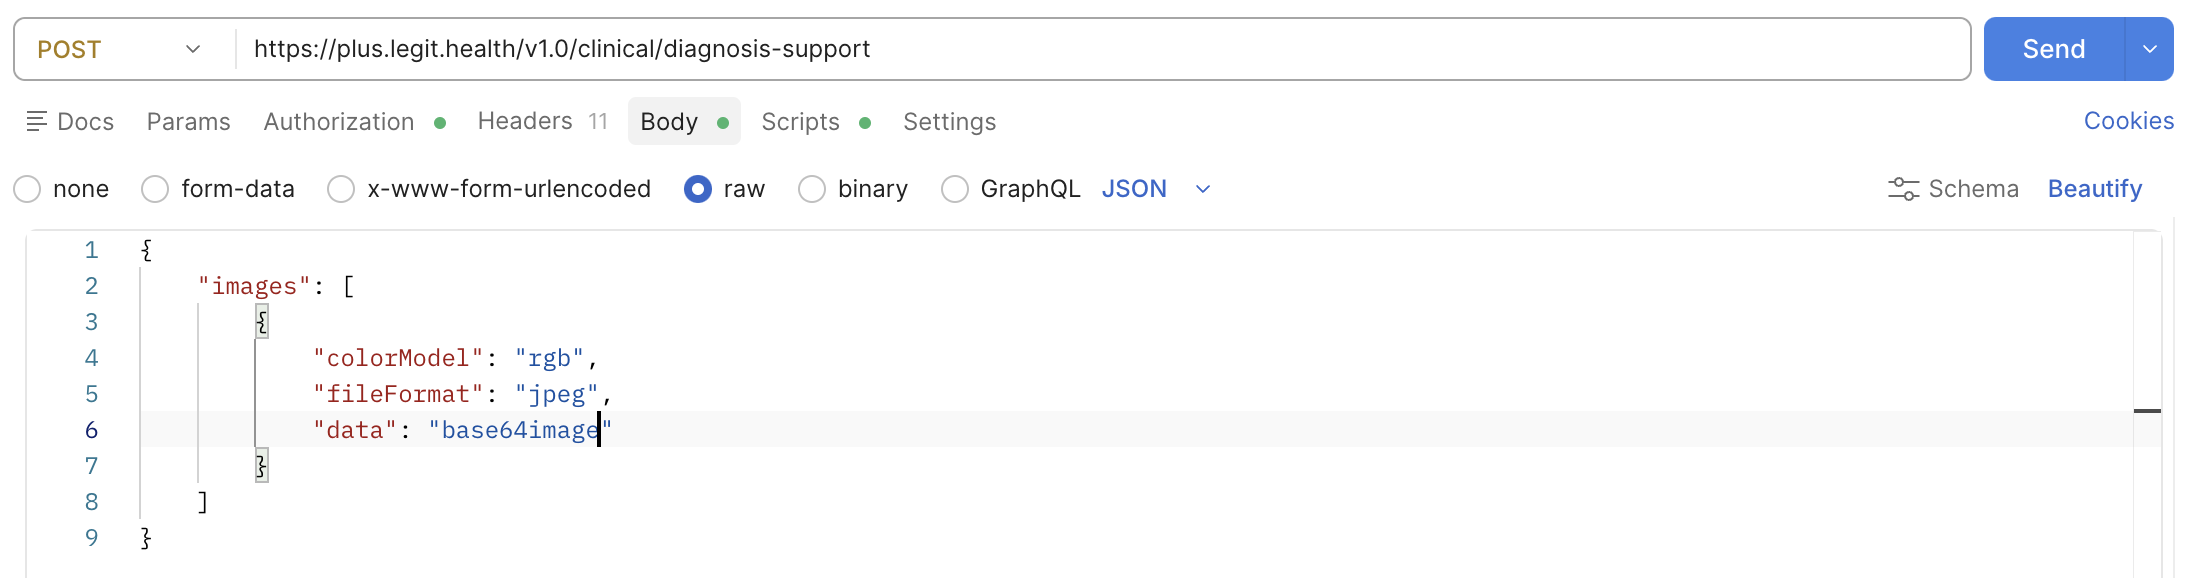
Code Examples
Body Request:
{
  "images": [
    {
      "colorModel": "rgb",
      "fileFormat": "jpeg",
      "data": "base64image"
    }
  ]
}
Note: Replace "base64image" with the actual base64-encoded string of your image. You can use Materials I: Basic Integration image base 64 example for testing.
Programming Language Examples
Python Examples
import requests

url = "{path}/clinical/diagnosis-support"
headers = {
    "Authorization": "Bearer your_access_token",
    "Content-Type": "application/json"
}
payload = {
    "images": [
        {
            "colorModel": "rgb",
            "fileFormat": "jpeg",
            "data": "base64image"
        }
    ]
}

response = requests.post(url, json=payload, headers=headers)
print(response.json())
Severity Assessment /clinical/severity-assessment
Using Postman
Screen capture of Authorisation tab of the Postman desktop app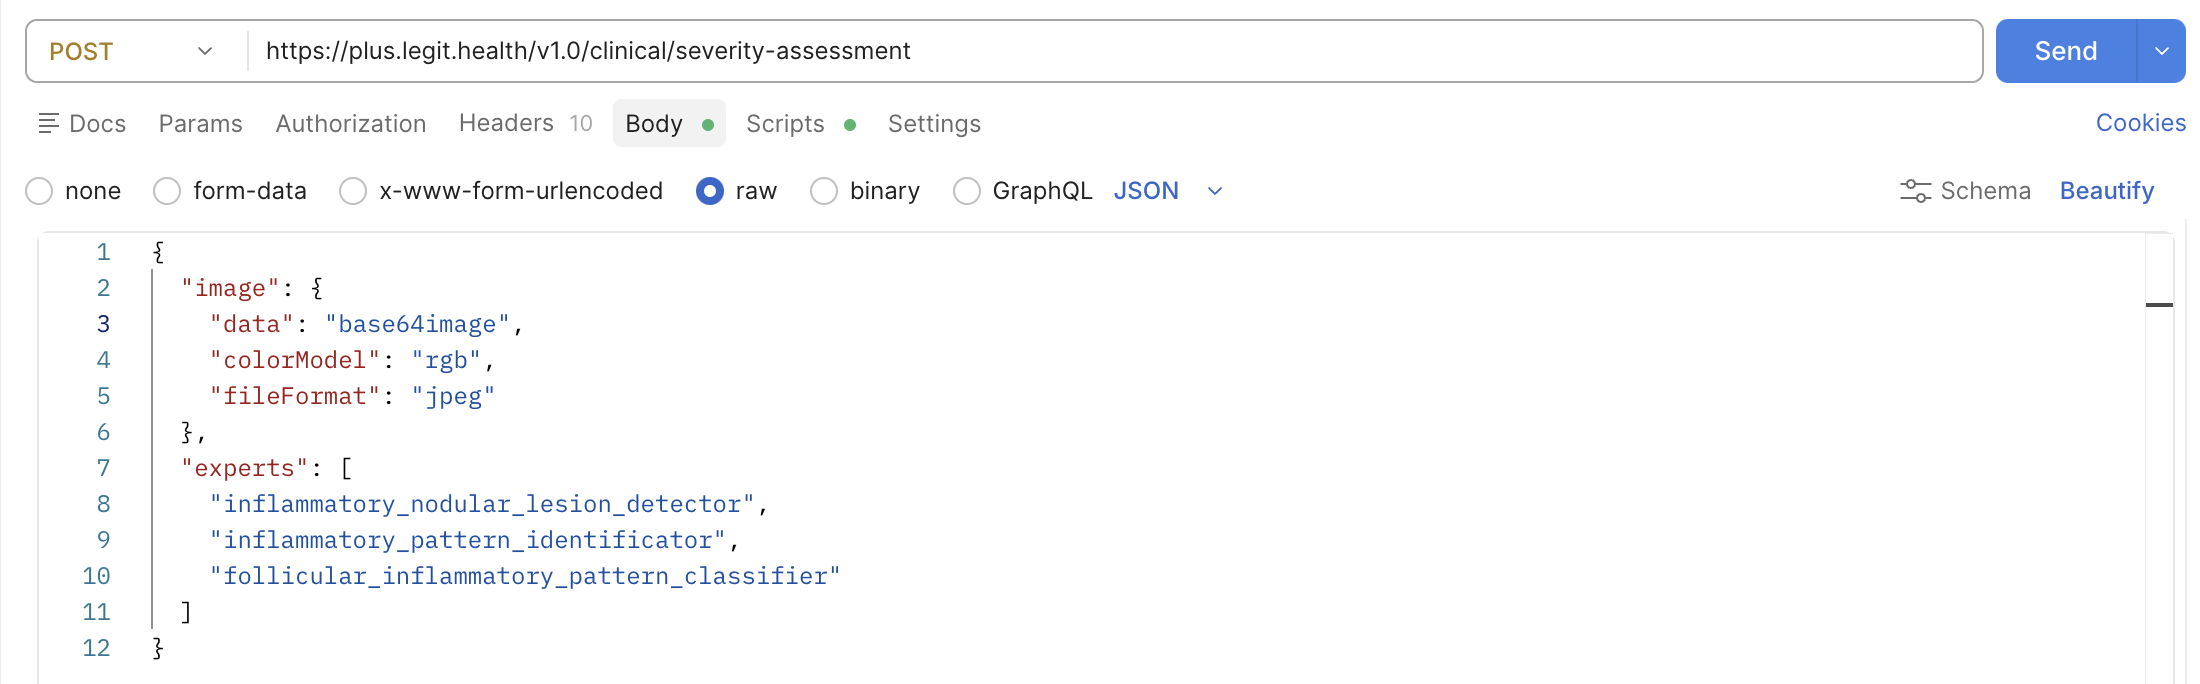
Code Examples
Request:
{
  "image": {
    "data": "base64image",
    "colorModel": "rgb",
    "fileFormat": "jpeg"
  },
  "experts": [
    "inflammatory_nodular_lesion_detector",
    "inflammatory_pattern_identificator",
    "follicular_inflammatory_pattern_classifier"
  ]
}
Considerations & PDF Troubleshooting
Please ensure that all requests and responses are formatted correctly according to the JSON API specification. For any issues encountered during integration or while generating PDFs, refer to the troubleshooting section in the official documentation or contact our support team for assistance.
Next steps
Once you have reviewed this guide, you can proceed to consult the detailed API documentation to ensure proper implementation of each endpoint. Thank you very much, and we remain at your disposal for any questions you may have.